Transform data into actionable insights for growth.
Track and share performance at a glance.
Unlock the value of your data.The ability to make effective use of data will be the differentiator between organizations who grow and those who are left behind.
Reporting software for everyone.Give anyone in your organization the power to create reports and dashboards with clear visualizations and easy-to-read charts.
Increase team performance.Provide your staff with the answers they need to drive change and increase performance across your organization.
It’s all in the numbers.
Our reporting engine helps you measure KPIs and identify opportunities for growth.
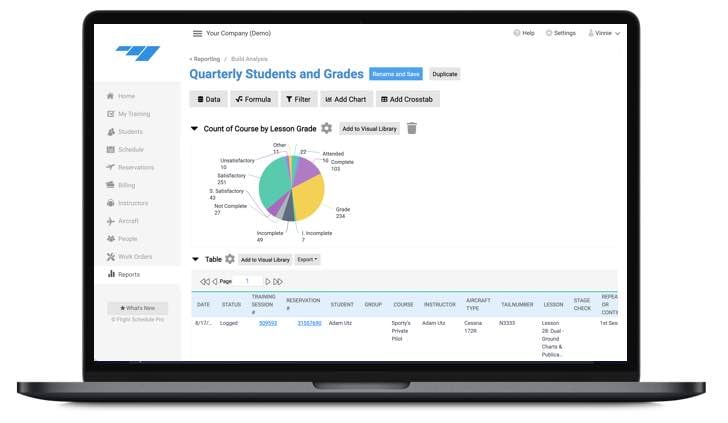
Tabular reports with custom columns, sorting, graphs, and more.
Combine data sets with saved filters and easily share within your organization. Advanced functions enable charts, formulas, and crosstabs for deeper analysis.
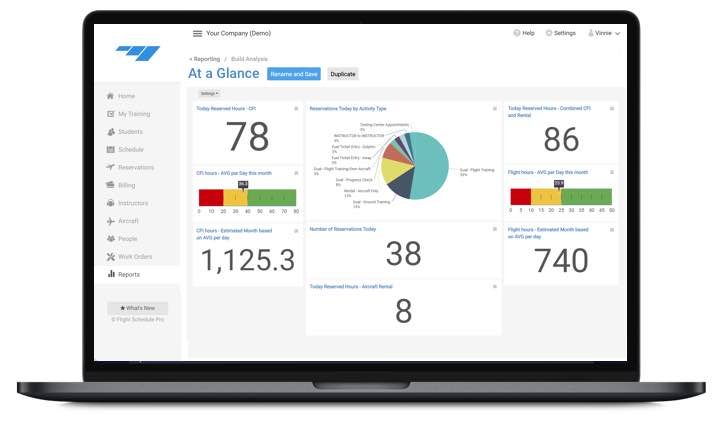
Create and share visual dashboards and reports with your team to monitor data and KPIs that matter. Get "eyes" on potential problem areas before they impact safety or your bottom -line.
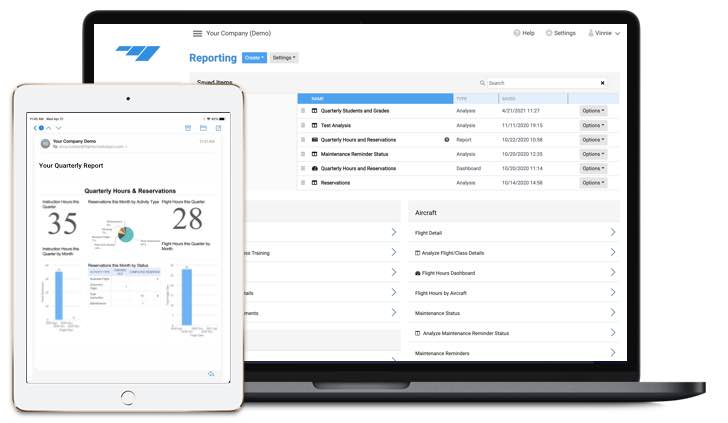
Keep everyone on the same page without manual work. Deeply customize and send reports by email to anyone on a schedule you decide.
Tabular reports with custom columns, sorting, graphs, and more.
Combine data sets with saved filters and easily share within your organization. Advanced functions enable charts, formulas, and crosstabs for deeper analysis.
That which is monitored, can be improved.
Create and share visual dashboards and reports with your team to monitor data and KPIs that matter. Get "eyes" on potential problem areas before they impact safety or your bottom -line.
Send reports by email automatically.
Keep everyone on the same page without manual work. Deeply customize and send reports by email to anyone on a schedule you decide.
7 KPIs for Tracking the Success of Your Flight Training Operation
Get the most out of your data with dynamic reporting features, data visualizations, and formatting options designed to help you create your reports like a pro.
Aircraft Availability
Reservation Fulfillment Rate
Upcoming Maintenance & Services
Number of Hours Flown
Scheduling Efficiency by Type or Timeframe
Hourly Performance
Total Revenue & Open Invoices
Taxes Owed
Sales by Aircraft, Account, or Product Types
Number of Sessions Conducted
Number of Active Students
Student Progress & Performance
Enrollment & Retention Trends
Instructor Pass Rates
Graduation Rates
Ready to get started?
Explore why 1,100 flight schools, universities, and flying clubs manage their operations on Flight Schedule Pro.